Welcome to The Virtuous Graph
Graph as Code; Code as Graph
Our motto represents our vision of programming: taking a graph-centric approach to programming itself - to visualize the program as a graph and ultimately to modify a graph to modify a program.
Graphs come from many sources and are manifested in many forms. While we contend code is itself a graph, in terms of data, the most common source by far are spreadsheets. Manifesting spreadsheets as graphs include the pure visualization, our favorite being 3D, and the operational, our preferred choice unquestionably being the Labeled Property Graph from Neo4j.
Graphs:
Trees
Exceptional Trees in Hawaii: 3D
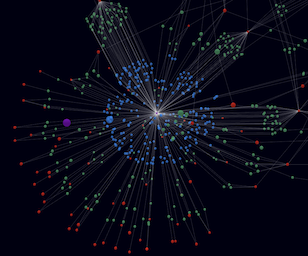
This is the transformation of a spreadsheet of Exceptional Trees in Hawaii, their names, species, locations, and island, into a 3D Force Graph. The 3D view allows some new perspective for exploring a dataset.
Trees
Exceptional Trees in Hawaii: Cypher
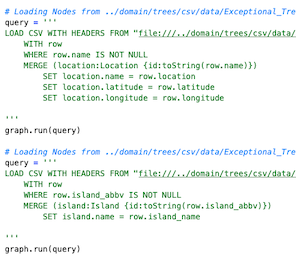
This is the transformation of a spreadsheet of Exceptional Trees in Hawaii, their names, species, locations, and island, into Cypher Code.
Colors
Recursive generation of RGB colors
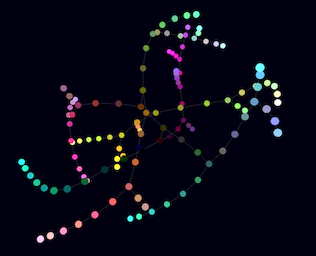
This shows two things. First, the progression of colors as fixed, incremental changes are made in one of the color dimensions. Second, the recursion itself is revealed as changes are made along the different dimensions and until all changes are completed.
Both the 3D view and the Cypher code were generated from our RadialNEXUS manifest script. The script takes a data spreadsheet and a mapping spreadsheet. The data spreadsheet has rows and columns for representing the data in a domain. The mapping spreadsheet maps the columns in the data spreadsheet to the nodes and attributes in the graph representation along with the edges between those nodes. We're in the process of packaging the code further but like to gauge interest first. Please email me at michaelbauer.com if you'd like to learn more.